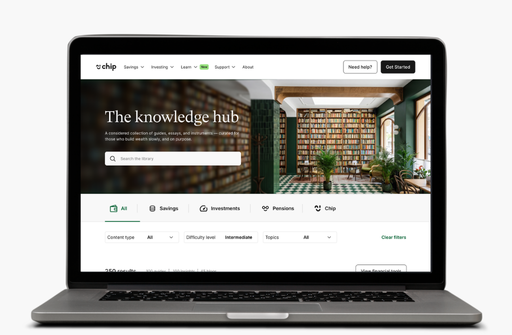
The knowledge hub

A considered collection of guides, essays, and instruments — curated for those who build wealth slowly, and on purpose.

0
results
View tools
Filter results
Filter by:
Content type
Difficulty level
Topics
0
results
View financial tools

What is a bear market?

2 min read
Beginner
Investing basics

A bear market is a period when a major market index, such as the UK's FTSE 100 or the US's S&P 500, falls by 20% or more from its recent highs. This market environment is characterised by widespread pessimism. Investor confidence is low, leading many to sell stocks, which in turn pushes prices down further. This is the direct opposite of a bull market, where prices are rising and optimism is high.

When are we in a bear market?

Bear markets can only be identified retrospectively, once a market index has fallen more than 20%. It is a backwards-looking label rather than a real-time indicator. 

However, certain economic signals often precede or accompany a bear market. These can include:

  • Slowing economy: Key indicators like rising unemployment, a drop in corporate profits, and reduced consumer spending often signal an economic downturn that can lead to a bear market.
  • Rising interest rates: Central banks, such as the Bank of England, raise interest rates to combat inflation. This can make borrowing more expensive, cooling the economy and sometimes triggering a market downturn.
  • Geopolitical events: Major global events, such as wars or energy crises, create uncertainty and can cause investors to sell off assets in a flight to safety.

How long do bear markets last?

There are different types of bear markets, and typically recovery times differ depending on the cause. Research from Goldman Sachs1 identifies three distinct categories of bear market based on historical stock market data:

  • Structural bear markets such as the Global Financial Crisis in 2007-2008 are triggered by a market imbalance and ‘bubbles’. By far the most severe type, average declines are around 60% and recovery time is around a decade. 
  • Cyclical bear markets are tied to rising and falling economic cycles, and can be triggered by economic headwinds such as rising interest rates, impending recessions, and declining profits. Average declines are around 30%, which last an average of two years, and take about five years to fully recover. 
  • Event-driven bear markets are triggered by single events such as wars, oil prices shocks, or a global crisis such as the Covid pandemic. Recovery periods are shorter, typically lasting around eight months, with full recovery in around a year. 

What does bearish mean?

If you are a bear in the market, you are a stock market pessimist, and believe that prices are going to experience a downward trajectory. This is the direct opposite of being bullish, which is a belief that prices are heading upwards. 

A bear in the stock market might react differently depending on strategy and risk appetite. Some adopt a very high-risk strategy called short-selling, essentially betting on the falling price of a stock or market index, by borrowing shares from a lender, selling them on the open market, then selling them back to the lender at the (hopefully) lower price and profiting from the difference. 

Other bears might take a more defensive position, moving to ‘safe-haven’ assets such as cash and bonds, in an attempt to preserve or even grow capital during a market downturn.

How to approach a bear market?

There is no one-size-fits-all approach to a bear market event, but for investors with a long-term horizon, the same key principles apply.

  1. Avoid panic selling: keeping calm in the event of a market downturn is crucially important if prices have already fallen, and selling will simply ‘lock in’ any losses you’re seeing in your portfolio. You risk missing the recovery period, and could derail your long-term goals. 
  2. Review your goals: if your financial goals are still years away, you likely have sufficient time to wait out the downturn. Familiarising yourself with the upward trends of the stock market over time can help put things in perspective.
  3. Stay diversified: spreading your investments across different asset classes and regions, can help cushion the impact of a bear market, particularly in event-driven circumstances that can be specific to an industry or market region. 
  4. Regular investments: continuing to invest a fixed amount, whatever the price, can help smooth out the ups and downs of the market. In a bear market, these investments are taking advantage of lower prices and potentially increasing returns when the market recovers. 

While bear markets can be unsettling, they’re a natural feature of the economic cycle, and can even present opportunities if navigated properly. Historically, bear markets in global markets have eventually been followed by a new bull market and a period of economic recovery, so staying the course if your financial goals allow it can be the best route for investors. 

All that glitters - gold keeps proving its worth

2 min read
Intermediate
Asset classes

Several forces are pushing gold higher:

  • Global uncertainty: Concerns over U.S. monetary policy, rising trade tensions, and inflation are driving investors toward safer assets. Just in case.2

  • Central bank buying: Countries like China, India, and Turkey continue to stockpile gold, reinforcing its role as a long-term store of value.3
  • Weaker dollar & rate cut bets: Investors are anticipating future rate cuts, making non-yielding assets* like gold more attractive.4

*Chip explains: Non-yielding assets are investments that don’t pay you an income while you hold them, so their value comes from the price itself

Why it matters for you

Gold’s latest rally is a strong reminder of why it has held its place in portfolios for centuries. It isn’t about explosive growth or short-term gains – it's about stability, protection, and balance. 

In times of uncertainty, gold can act as a hedge against inflation and market swings, helping to smooth out the bumps. Think of gold as the solid foundation that can support your more growth-focused investments. 

With prices now* at record highs, the message is clear: gold continues to earn its reputation as a safe haven. For investors, that means confidence that even when markets are unpredictable.

But always remember to take a balanced view. Past performance is not a reliable indicator of future results and the price of gold can go down as well as up.

*Accurate as of 2 September 2025 spot gold price at $3,529.01 per ounce.


How Chip can help you take advantage

At Chip, we offer exchange-traded commodities (ETCs) such as Physical Gold, which gives you a way of tracking the price and performance of the gold price, without the costs and admin of owning physical gold bullion. 

If you want to get involved, you can open a Stocks & Shares ISA in minutes. Invest from £1, and manage everything right from our app. Just go to the ‘Invest’ tab to get started.


Source: 1 BBC 2 JP Morgan 3 The National 4 The Economic Times 

The U.S. Government has ‘gone fishing’ (but don't worry)

2 min read
Expert
Economic context

A US government shutdown* has been triggered after a deadline to reach a funding agreement before the start of the new fiscal year (1 October) came and went without a deal.

Noisy headlines like these can feel unsettling, but history shows that markets usually take them in stride. While shutdowns can cause short-term noise, they rarely derail the bigger picture for long-term investors.¹

Chip explains: What is a government shutdown?: In the U.S., Congress has to approve funding for government operations. If lawmakers can’t agree on a budget before the 1 October deadline, parts of the government temporarily close until a deal is reached.

What might happen in the short term?

  • Data delays: Key economic reports could be postponed, creating a temporary “blind spot” for analysts and traders.
  • Government-linked sectors: Contractors and defence companies may face small payment lags, but these tend to be resolved once funding resumes.
  • Market sentiment: Expect some short-term jitters and reactive headlines in the news cycle, but past shutdowns haven’t caused lasting damage.

Why investors don’t need to panic

The most important thing to note is that history is on your side. U.S. markets have been largely unaffected by previous shutdowns, with long-term returns back on track once political gridlock passes.2

Diversification also plays an important role. By spreading your money across different regions, sectors, and asset classes, you avoid being overly exposed to temporary political standoffs like this.

And most importantly, while headlines can spark short-term nerves, it’s worth remembering that the bigger picture matters far more than these short-lived disputes, so stick to the plan.  

How Chip helps you stay steady

At Chip, we keep investing simple and diversified. Choose from over 40 investment funds – offering clear, curated choices without overwhelming you with thousands of options.

If you’re investing for the long term, the message is clear. Stay the course, let diversification do its job, and keep your goals in focus.

Head to the ‘Invest’ tab in your Chip app and see how you could put your money to work today with a tax-free Stocks & Shares ISA or General Investment Account.

Sources:

1 JP Morgan

2 Voya

Markets respond to conflict in the Middle East: what it means for you

2 min read
Beginner
Investing strategies

We’re going to take a moment to comment on how events in the Middle East have impacted financial markets. This is a constantly evolving situation, so what you read here reflects the situation as of 12:00 GMT 13 March 2026. 

Before we start: What this could mean for your day-to-day 

Here’s a quick summary of the headlines that outline some of the knock-on effects of what a prolonged conflict might mean. 

The fuel & bills effect: Regional tension spikes oil prices, which is important, as it's a direct link to higher costs at the petrol pump and potentially stickier energy bills at home. (This Is Money)

Shopping basket surcharge: Rerouting ships to avoid hotspots adds weeks to journeys and millions to freight costs. This eventually makes everything from electronics to your weekly food shop more expensive. (Retail Gazette)

Mortgage & interest rate link: If costs stay high, inflation becomes harder to "kill off." This makes the Bank of England less likely to cut interest rates, meaning those cheaper mortgage deals could stay out of reach for longer. (BBC)

When conflict erupts, and geopolitical events intensify, the reaction can be swift. Institutional investors try to assess potential impacts on global trade, energy prices, and broader economic stability. That uncertainty can lead to short-term volatility.

Energy markets tend to be particularly sensitive to developments in the region because of the Middle East’s importance to global oil supply.1 Even the possibility of disruption can influence prices and investor sentiment, and because energy affects all walks of life, the reaction is global.

As a result, stock markets have seen fluctuations over the last 12 days, reflecting a familiar pattern: geopolitical news triggering short bursts of market movement.

Why markets often react this way

Financial markets are forward-looking and like certainty. When unforeseen events occur, whether it’s conflicts, elections, or diplomatic developments, this can make the economic outlook suddenly unpredictable.

In the short term, this presents itself as volatility in our investments.

But historically, markets tend to process these events relatively quickly. Once the immediate uncertainty fades or events become clearer, investors usually shift their attention back to economic fundamentals like corporate earnings, growth forecasts, and central bank policy.2

Volatility is part of the investing journey

While it can feel unsettling, volatility is a completely normal part of investing.

Even in strong market years, markets regularly experience temporary dips or fluctuations. These moments often reflect the market adjusting to new information, such as shifting interest rate forecasts, unexpected corporate earnings reports, or sudden geopolitical developments like we’ve seen this week.

Importantly, many geopolitical shocks in the past have caused short-term market reactions but had limited long-term impact on global equities.3

For long-term investors, these periods are simply part of the journey.

Keeping perspective as an investor

When headlines dominate the news cycle, it can be tempting to react quickly. But long-term investing usually benefits from staying focused on the bigger picture.

Market history shows that reacting to short-term volatility can sometimes do more harm than good. Instead, many investors focus on maintaining a diversified portfolio and continuing to invest consistently over time.4

This approach helps smooth out the ups and downs that naturally occur in markets.

Final thought

While global events can influence markets in the short term, long-term investing is about staying committed to your goals, through both calm and uncertainty.

Ultimately, your portfolio should be centred on the future, not the news cycle. By staying consistent and zooming out, you’re ensuring that when the dust settles, your long-term financial plan is still on track.

Sources:

1International Energy Agency (IEA) 2Vanguard 3J.P. Morgan 4Fidelity

Why Wall Street fund managers are piling back into stocks

2 min read
Intermediate
Investing trends

The big money on Wall Street is changing its tune. According to the latest Bank of America Global Fund Manager Survey1, professional investors are the most optimistic on global equities investing they’ve been since February, snapping up stocks at a rate not seen in seven months.

So, what's behind this sudden surge of optimism?

Two big fears have faded

Previous months’ data has reflected fears in the market of a global recession triggered by a trade war, and central banks hiking interest rates to tackle inflation. September’s data shows that fund managers believe the worst of both threats is now in the rearview mirror.

  1. Fears of a trade war are rapidly diminishing. This has caused the biggest one-month jump in global growth expectations in nearly a year.
  2. Investors are now betting heavily on the Federal Reserve starting to cut interest rates. With inflation concerns easing, 47% of managers expect the Fed to cut rates four or more times in the coming year. Cheaper borrowing costs tend to boost stock market growth, and managers are positioning their portfolios accordingly.

So, what are they buying?

The survey shows that cash levels remain low, meaning these giant funds are holding back less of a safety net for unforeseen changes. 

The destination for much of this cash is the "Magnificent 7" — the huge US tech firms like Apple, Microsoft, and NVIDIA that have become household names. It's a powerful vote of confidence in the biggest growth drivers of the global economy.

Managers are backing AI with 48% of respondents thinking “AI stocks are not in a bubble” and 50% said “AI is already increasing productivity”. 

How you can get involved with Chip

Investing with Chip gives you access to a curated range of investment funds. These funds give you access to a basket of assets, including the global and tech stocks mentioned here — but you won’t need to pick the winners. Funds like the S&P 500, NASDAQ 100, and FTSE All-World track the price of hundreds of companies, with the “Magnificent 7” stocks currently leading these indexes. 

Start investing from £1. Open a Stocks & Shares ISA or General Investment Account, and you can get started in a few simple steps!

Sources

1TradingView

FTSE 100 frontrunner eyes up £200 billion valuation

2 min read
Intermediate
Global cap giants

AstraZeneca, the FTSE 100’s largest company, is powering towards a potential £200 billion valuation this year.1 The pharmaceutical giant is regaining momentum as tariff concerns fade, with robust earnings and promising clinical trial results reigniting investor confidence.

What’s driving AstraZeneca’s recent growth?

  • Pipeline momentum: Positive trials in new treatment for high blood pressure Baxdrostat, as well as multiple new regulatory approvals across oncology, cardiovascular and rare disease therapies. 
  • Strong financial results: Total revenue was up 9% in H1 2025 to £21.3 billion, operating profit rose 23% to £5.46 billion, and pre-tax profit rose 26% to £4.96 billion. 
  • Regulatory clarity in China: Investigations into the company’s tax and insurance practices are nearing resolution, with fines expected to be minimal.
  • Tariff risk under control: Reassurance on the impact of US trade policy, with tariffs seen as manageable. 

If AstraZeneca continues to post strong earnings results and investors continue their vote of confidence, hitting the £200 billion valuation before the end of the year could be within reach.1 

Why does this matter?

As the FTSE 100’s largest company, solid growth from mega-cap stocks like AstraZeneca is enough to have a positive impact on the whole index. 

Although one stock's growth doesn’t indicate a trend for other stocks in the FTSE 100, it does show us how strong innovation and earnings (even in the face of adversity) can continuously drive value and resilience. 

For long-term investors, AstraZeneca’s rally reinforces the case for focusing on high-quality companies with a history of long-term growth often found in market-cap weighted indexes like the FTSE 100 or S&P 500. 

Where does Chip come in?

With Chip, you can invest in index funds like the FTSE 100, which track the price of huge companies like AstraZeneca. Companies move in and out of the underlying index based on their market cap (value of total shares), so you can be sure you’re always investing in the 100 most valuable stocks. 

Open a Stocks & Shares ISA or General Investment Account, choose your funds, and you’re away!

Sources

1TheMotleyFool

Biggest companies in the USA by market cap

2 min read
Beginner
Global cap giants

What are the biggest companies in the USA by market cap?

This list ranks the USA’s biggest companies by market capitalisation; the cumulative value of a company's total outstanding market shares. We’ll also be highlighting other key figures, such as the company's revenue, gross profit, and 1-year return (all based on the previous fiscal year). 

Some other key facts such as the exchange the company is listed on, the founding year and country the company is headquartered in are also covered. 

1. NVIDIA Corp.

  • Market cap: $4.50 trillion
  • Revenue: $165.22 billion
  • Gross profit: $115.4 billion
  • 1-yr return: +48.04%
  • Exchange: Nasdaq
  • Year founded: 1993
  • Country: United States

NVIDIA designs powerful chip solutions supplying various innovative industries:

  • AI and datacentres: GPUs that companies like Microsoft and Google use to build AI services. 
  • Gaming: ‘GeForce’ graphics cards that power high-quality video games on PCs. 
  • Professional & Automotive: Chips for film special effects, car infotainment systems, and self-driving technology.

2. Microsoft Corp.

  • Market cap: $3.89 trillion
  • Revenue: $281.72 billion
  • Gross profit: $193.89 billion
  • 1-yr return: +25.96%
  • Exchange: Nasdaq
  • Year founded: 1975
  • Country: United States

Microsoft’s software offers a range of services to businesses and consumers:

  • Cloud computing: Supply computer power and storage to businesses using their Azure software. 
  • Software: The Windows operating system and Office suite (Word, Excel, Powerpoint) powers PCs and productivity for businesses and consumers.
  • Gaming: Own Xbox and major gaming franchises like Call of Duty.
  • Other: Invest in AI with their OpenAI partnership and own professional social network LinkedIn.

3. Apple Inc.

  • Market cap: $3.81 trillion
  • Revenue: $408.63 billion
  • Gross profit: $190.74 billion
  • 1-yr return: +14.24%
  • Exchange: Nasdaq
  • Year founded: 1976
  • Country: United States

Apple are a global giant in consumer electronics and digital services:

  • Consumer electronics: iPhone, Mac computers, iPads, the Apple Watch, and AirPods.
  • Services: App Store, Apple Music, iCloud storage, and Apple TV+.

4. Alphabet Inc. (Google)

  • Market cap: $2.98 trillion
  • Revenue: $371.21 billion
  • Gross profit: $218.73 billion
  • 1-yr return: +46.11%
  • Exchange: Nasdaq
  • Year founded: 2015
  • Country: United States

Most of Alphabet's revenue comes from advertising on its Google Search and Youtube platforms:

  • Google Search & Ads: Core revenue stream comes from selling ads on their search engine and network of other websites. 
  • Android: Operating system with widespread applications in mobile devices.
  • Youtube: World’s largest online video platform, generating revenue from advertising on videos. 
  • Google Cloud: Cloud computing business that competes with Microsoft and Amazon.
  • Other bets: Series of investments in future facing projects (Access, Calico, CapitalG, GV, Verily, Waymo, and X)

5. Amazon.com Inc. 

  • Market cap: $2.37 trillion
  • Revenue: $670.04 billion
  • Gross profit: $332.38 billion
  • 1-yr return: +21.22%
  • Exchange: Nasdaq
  • Year founded: 1994
  • Country: United States

Amazon’s two main revenue streams are its world leading online store and cloud computing services:

  • E-Commerce: Amazon generates profit from selling its own products and charging commission to sellers on their platform. They also make money from advertising on the site and their Amazon Prime subscription services. 
  • Amazon Web Services (AWS): Largest revenue source for Amazon comes from its market leading cloud computing services — clients include Netflix and NASA.  

6. Meta Platforms Inc. 

  • Market cap: $1.79 trillion
  • Revenue: $178.8 billion
  • Gross profit: $146.53 billion
  • 1-yr return: +19.20%
  • Exchange: Nasdaq
  • Year founded: 2004
  • Country: United States

The social media giant that owns Facebook, Instagram, Messenger, and WhatsApp; nearly all of its revenue comes from the highly targeted advertising that reaches its user base.

  • Targeted ads: Driven by data collected from their users base that allows advertisers to target different user groups.
  • The Metaverse: Investing billions of dollars developing virtual and augmented reality hardware and software. 

7. Broadcom Inc. 

  • Market cap: $1.59 trillion
  • Revenue: $59.93 billion
  • Gross profit: $37.83 billion
  • 1-yr return: +92.43%
  • Exchange: Nasdaq
  • Year founded: 1961
  • Country: United States

Technology company designing chips for networking and smartphones, and sells essential software to large corporations. 

  • Semiconductors (Chips): They design and sell a wide range of chips essential for Wi-Fi and Bluetooth in smartphones (key supplier for Apple), as well as networking equipment in data centers. 
  • Cloud services: Large software companies (like VMware) that supply big businesses with IT and cloud computing infrastructure on a subscription basis. 

8. Tesla Inc.

  • Market cap: $1.44 trillion
  • Revenue: $92.72 billion
  • Gross profit: $16.21 billion
  • 1-yr return: +73.93%
  • Exchange: Nasdaq
  • Year founded: 2003
  • Country: United States

Tesla is the world’s leading manufacturer of electric vehicles, with further focus on energy and artificial intelligence.

  • Electric cars: Main source of revenue and profit comes from their line of EVs like the Model Y, Model 3, Model X and Cybertruck. 
  • Energy generation & storage: Renewable energy for consumers and businesses from solar panels and batteries — the Powerwall for homes and Megapack for utility companies. 
  • Future goals: A large portion of Tesla’s valuation is based on future plans for technology like full self-driving technology and developing humanoid robots. 

9. Berkshire Hathaway Inc.

  • Market cap: $1.08 trillion
  • Revenue: $370.15 billion
  • Gross profit: $89.41 billion
  • 1-yr return: +8.69%
  • Exchange: New York Stock Exchange
  • Year founded: 1893
  • Country: United States

A huge holdings company that owns and invests in a diverse network of businesses.

  • Owns companies: Key examples include GEICO (car insurance), BNSF (major American railway) and Duracell (batteries). The profits of all these companies flow into Berkshire. 
  • Invests in stocks: They own a huge stock portfolio with large holdings in Apple, American Express, Bank of America and the Coca-Cola Company.
  • The model: They use cash from their businesses profits and stock growth to buy more businesses and stock, creating a powerful cycle of long-term growth. 

10. JP Morgan Chase & Co.

  • Market cap: $846.07 billion
  • Revenue: $278.82 billion
  • Gross profit: N/A
  • 1-yr return: +45.80%
  • Exchange: New York Stock Exchange
  • Year founded: 1893
  • Country: United States

The largest bank in the United States and a leading global financial institution, operating under two brand names: J.P. Morgan and Chase.

  • Consumer and community banking (Chase): serves tens of millions of customers within the US with current and savings accounts, credit cards, mortgages and car loans.
  • Corporate and investment banking (J.P. Morgan): serves huge global clients like corporations and governments, with banking and advisory services; helping facilitate mergers and acquisitions (M&A) and managing stock market listings (IPOs). 

What are the biggest companies by total annual revenue?

  • Walmart: $680.99 billion
  • Amazon: $637.96 billion
  • UnitedHealth Group: $400.28 billion
  • Apple: $391.04 billion
  • CVS Health Corporation: $372.69 billion

What are the biggest companies by workforce?

  • Walmart: 2.1 million
  • Amazon.com: 1.56 million
  • UPS: 490,000
  • Home Depot Inc.: 470,100
  • Concentrix Corporation: 450,000

Summary

Understanding a company's performance is crucial; it's how you truly know what you own. These metrics directly drive the value of your stocks and funds. When you understand these key drivers, you can navigate market changes with confidence, rather than just reacting to headlines.

All market data sourced from TradingView as of 08.10.2025.

Biggest companies in Japan by market cap

2 min read
Intermediate
Global cap giants

What are the biggest companies in Japan by market cap?

This list ranks the biggest public companies in the Japanese market by market capitalisation. We’ll also highlight other key figures, such as revenue, gross profit, and 1-year return. Key facts like the company's exchange, founding year, and country are also covered.

1. Toyota Motor Corp. 

  • Market cap: $246.8 billion
  • Revenue: $329.03 billion
  • Gross profit: $63.5 billion
  • 1-yr return: +14.38%
  • Exchange: TSE
  • Year founded: 1937
  • Country: Japan

Designs, produces, and sells a wide range of vehicles across several brands. Their philosophy is key to their success, focusing on eliminating waste and continuous improvement (“kaizen”). This has built them a reputation for quality and long-term reliability. 

  • Automotive sales: Largest source of revenue generated from sales of their core Toyota brand, their luxury division Lexus, and other brands like Daihatsu (small cars) and Hino (trucks). 
  • Hybrid technology: pioneer of hybrid tech with the iconic Prius, with future strategy focusing on a diverse approach to electrification, and investment in next-gen electric cars and solid-state batteries. 

2. SoftBank Group Corp. 

  • Market cap: $194.89 billion
  • Revenue: $25.74 billion
  • Gross profit: N/A
  • 1-yr return: +137.88%
  • Exchange: TSE
  • Year founded: 1981
  • Country: Japan

A multinational conglomerate holdings company renowned for making huge, bold investments in the world’s boldest and most innovative tech companies.

  • Vision fund: one of the world’s largest venture capital funds, with multi-billion dollar investments in late-stage startups and public companies across sectors like Artificial Intelligence (AI), biotech, and fintech.
  • Arm holdings: its most valuable asset is its huge stake in the British firm that designs chips for most of the world’s smartphones, whilst maintaining interests in telecommunications and other technology assets. 

3. Mitsubishi UFJ Financial Group 

  • Market cap: $174.52 billion
  • Revenue: $81.70 billion
  • Gross profit: $8.28 billion
  • 1-yr return: +59.18%
  • Exchange: TSE
  • Year founded: 2001
  • Country: Japan

Japan’s largest bank and one of the world’s leading full-service financial institutions.

  • Retail and commercial banking: serving millions of customers and businesses across Japan through its main banking unit, MUFG Bank, offering a full suite of services from deposits and loans to wealth management.
  • Corporate and investment banking: provides large-scale financing, treasury, and securities management services to multinational corporations and institutional investors globally. 

4. Sony Group Corporation

  • Market cap: $171.37 billion
  • Revenue: $85.36 billion
  • Gross profit: $25.13 billion
  • 1-yr return: +60.77%
  • Exchange: TSE
  • Year founded: 1946
  • Country: Japan

A huge Japanese conglomerate that has evolved from a legendary electronics maker into a global entertainment and technology giant. 

  • Entertainment empire: Sony Gaming produces the iconic PlayStation, Sony Music is one of the world’s largest record labels, and Sony Pictures produces major Hollywood films and TV.
  • Technology: leader in high-end consumer electronics like Bravia TVs and Alpha camera, but its most critical business is imaging and sensing solutions, where it is a world leading manufacturer of the camera sensors used in a majority of smartphones, including the iPhone. 

5. Hitachi Ltd.

  • Market cap: $130.93 billion
  • Revenue: $85.36 billion
  • Gross profit: $19.29
  • 1-yr return: +18.35%
  • Exchange: TSE
  • Year founded: 1980
  • Country: Japan

An industrial conglomerate that’s evolved from a heavy industry giant to a technology leader focused on IT and social industry.

  • Digital systems and services: IT solutions for its business customers focusing on data storage, AI, and its ‘Lumada’ Internet of Things platform (connects physical machinery to digital analytics).
  • Green energy, mobility and connective industries: build and maintain critical infrastructure, from high speed rail, power grids, construction machinery and advanced automotive components.

6. Sumitomo Mitsui Financial Group 

  • Market cap: $104.08 billion
  • Revenue: $64.18 billion
  • Gross profit: N/A
  • 1-yr return: +33.19%
  • Exchange: TSE
  • Year founded: 2002
  • Country: Japan

One of Japan’s largest ‘megabanks’, SMFG is a major global financial institution and holdings company that operates globally in retail, corporate, and investment banking.

  • Sumitomo Mitsui Banking Corporation: the group's main subsidiary, providing retail and commercial banking services to millions of individual customers and corporate clients across Japan.
  • Corporate and investment banking: serves multinational clients with project financing and trade finance, alongside its securities division, SMBC Nikko Securities, which handles brokerage and underwriting. 

7. Nintendo Co.

  • Market cap: $98.33 billion
  • Revenue: $10.12 billion
  • Gross profit: $5.04 billion
  • 1-yr return: +65.57%
  • Exchange: TSE
  • Year founded: 1889
  • Country: Japan

World famous pioneer of the video game industry. The mastermind behind the Wii, DS, Switch and a range of iconic games.

  • Consoles and hardware: core focus of the business, having evolved from the iconic Nintendo 64 and GameCube, to the Switch and 3DS.
  • Games: some of the world’s most valuable entertainment intellectual property, such as Super Mario, The Legend of Zelda, and Pokémon franchises, which are being expanded into movies and theme parks.

8. Fast Retailing Co. 

  • Market cap: $95.33 billion
  • Revenue: $22.75 billion
  • Gross profit: $10.80 billion
  • 1-yr return: -2.63%
  • Exchange: TSE
  • Year founded: 1949
  • Country: Japan

Global fashion retail holding company that owns big names such as UNIQLO, GU, Theory and Helmut Lang.

  • UNIQLO: core business offering, operating thousands of stores worldwide. They focus on producing high-quality, functional and affordable basic apparel for a mass audience.
  • Other brands: focus on greater affordability through GU, and more premium offering through Theory.

9. Keyence Corporation 

  • Market cap: $92.19 billion
  • Revenue: $7.27 billion
  • Gross profit: $6.08 billion
  • 1-yr return: -12.61%
  • Exchange: TSE
  • Year founded: 1972
  • Country: Japan

A global leader in the development and manufacturing of factory automation sensors, measurement systems, and other industrial electronics.

  • Tech: its core business involves creating high-tech products like sensors, vision systems, and laser markers that are essential for automating production lines in industries such as automotive, electronics, and food packaging.
  • Sales: the company is renowned for its unique direct-sales business model, where a highly-trained salesforce works directly with customers on-site to solve complex engineering problems, leading to exceptionally high profit margins and a deep understanding of market needs.

10. Mitsubishi Corporation

  • Market cap: $88.25 billion
  • Revenue: $123.26 billion
  • Gross profit: $11.27 billion
  • 1-yr return: +15.42%
  • Exchange: TSE
  • Year founded: 1950
  • Country: Japan

Japan’s largest general trading company, Mitsubishi is a vast conglomerate that trades in nearly everything and acts as a major global investor.

  • Commodities and products: traditional business trades everything from sourcing and distributing energy, metals and chemicals to food and machinery.
  • Strategic investor: takes significant ownership stakes in businesses and develops large-scale industrial projects, such as power plants, mining operations, and retail enterprises around the world.

What are the biggest companies by total annual revenue?

  • Toyota Motor Corp.: $320.52 billion 
  • Honda Motor Co Ltd.: $144.71 billion 
  • Mitsubishi Corporation: $124.23 billion 
  • Itochu Corporation: $98.18 billion 
  • Mitsui & Co Ltd.: $97.78 billion

What are the biggest companies by workforce?

  • Toyota Motor Corp.: 383,850
  • NTT Inc.: 341,320 
  • Sumitomo Electric Industries Ltd.: 288,140
  • Hitachi Ltd.: 282,740 
  • Japan Post Holdings Ltd.: 218,720

Summary

Understanding a company's performance is crucial; it's how you truly know what you own. These metrics directly drive the value of your stocks and funds. When you understand these key drivers, you can navigate market changes with confidence, rather than just reacting to headlines.

Next we’ll be looking at the biggest companies in the USA by market cap.

All market data sourced from TradingView and company reports as of 06.10.2025.

Biggest companies in India by market cap

2 min read
Expert
Global cap giants

What are the biggest companies in India by market cap?

This list ranks the biggest public companies in the Indian market by market capitalisation. We’ll also highlight other key figures, such as revenue, gross profit, and 1-year return. Key facts like the company's exchange, founding year, and country are also covered.

1. Reliance Industries Ltd. (RELIANCE)

  • Market cap: $209.8 billion
  • Revenue: $108.41 billion
  • Gross profit: $29.94 billion
  • 1-yr return: -10.23%
  • Exchange: NSE
  • Year founded: 1957
  • Country: India

India’s largest and most valuable company, a globally reaching conglomerate with influence spanning energy, tech and consumer services. 

  • Oil-to-chemicals: This is Reliance’s core and most profitable division. It operates the world’s largest single-location oil refinery, and produces everything from transportation fuel to plastics, providing huge streams of cashflow to other areas of the business. 
  • Reliance Retail: India’s largest retailer with over 18,000 stores across the country, supplying its customers with groceries, electronics and fashion.
  • Jio Platforms (digital services): The largest mobile network operator in India with over 450 million subscribers, offering telecoms, streaming services (JioCinema), payment apps, and other online services. 

2. HDFC Bank (HDFCBANK)

  • Market cap: $163.47 billion
  • Revenue: $54.83 billion
  • Gross profit: N/A
  • 1-yr return: +8.76%
  • Exchange: NSE
  • Year founded: 1994
  • Country: India

India’s largest private-sector bank by assets, operating a broad spectrum of banking services with a strong focus on both individual consumers and large corporations. 

  • Retail banking: serves over 80 million customers across India with current and savings accounts, personal, car and business loans, and credit cards. 
  • Wholesale banking: provides medium and large-sized businesses, corporations and institutional clients with capital loans, trade finance, cash management solutions, and investment banking services.
  • HDFC merger: HDFC Bank merged with HDFC Ltd. — India’s largest housing finance company — in 2023. This gave HDFC Bank a massive book of home loans, making it a leader in the mortgage market.

3. Bharti Airtel Ltd. (BHARTIARTL)

  • Market cap: $122.05 billion
  • Revenue: $20.87 billion
  • Gross profit: $8.28 billion
  • 1-yr return: +9.59%
  • Exchange: NSE
  • Year founded: 1995
  • Country: India

One of the world’s leading telecommunications companies, with a significant presence across South Asia and Africa. In the Indian market, Airtel is a key rival of Reliance Jio, in mobile, broadband and digital services. 

  • Airtel India: serves over 300 million subscribers with mobile services, broadband, digital TV and payment services through their ‘Thanks’ app. 
  • Airtel Africa: leading telecom and money provider across 14 countries in Africa, providing mobile and data services, alongside mobile payments that allow users to transfer money, pay bills, and access other financial services. 

4. Tata Consultancy Services Ltd. (TCS)

  • Market cap: $117.99 billion
  • Revenue: $28.81 billion
  • Gross profit: $9.1 billion
  • 1-yr return: -32.62%
  • Exchange: NSE
  • Year founded: 1968
  • Country: India

A huge IT services and consulting company, part of the huge Tata Group multinational conglomerate. They rival big firms like Accenture and IBM as a global tech services leader.

  • IT services and consulting: providing a range of tech solutions to multinational corporations globally, with their cloud infrastructure, cybersecurity, data and analytics and bespoke software development.
  • Business and industry solutions: specialises in tailored industry-specific solutions, particularly within banking and financial services, and insurance — this is their largest source of revenue. They also have clients within retail, manufacturing and healthcare, helping them manage core processes like supply chain and customer relations. 

5. ICICI Bank Ltd. (ICICI)

  • Market cap: $108.28 billion
  • Revenue: $32.98 billion
  • Gross profit: N/A
  • 1-yr return: +4.33%
  • Exchange: NSE
  • Year founded: 1955
  • Country: India

One of India’s largest private-sector banks and a key player in the country’s financial system. A key competitor of HDFC Bank and the State Bank of India.

  • Retail banking: provides millions of customers with current accounts, savings accounts, personal loans, mortgages, and credit cards. It has a strong digital product presence from its iMobile Pay app, that provides a wide array of payment and banking services.
  • Corporate and institutional banking: Provides financial solutions to businesses of all sizes, including working capital finance, and term loans, alongside cash management and trade finance services to aid business operations. 

6. State Bank of India (SBIN)

  • Market cap: $90.5 billion
  • Revenue: $74.06 billion
  • Gross profit: N/A
  • 1-yr return: +8.8%
  • Exchange: NSE
  • Year founded: 1921
  • Country: India

India's largest public-sector bank and a cornerstone of the nation's financial system. With its unparalleled reach across the country, it is a dominant force in both retail and corporate banking.

  • Retail banking: Serves a massive customer base of over 450 million people through an extensive network of more than 22,000 branches. It is a leader in personal banking, offering services from basic savings accounts and home loans to wealth management, and operates the popular YONO digital banking app.
  • Corporate banking and treasury: Acts as the primary banker to many of India's largest corporations and state-owned enterprises, providing project finance, working capital loans, and treasury services. Due to its government ownership, it plays a key role in financing national infrastructure and industrial projects.

7. Bajaj Finance Ltd. (BAJFINANCE)

  • Market cap: $69.45 billion
  • Revenue: $7.75 billion
  • Gross profit: $4.88 billion
  • 1-yr return: +28.96%
  • Exchange: NSE
  • Year founded: 1987
  • Country: India

One of India's largest and most diversified non-banking financial companies (NBFCs). A leader in consumer finance, it is renowned for its rapid growth and use of technology to provide instant loans to millions of customers.

  • Consumer lending: This is the company's core business, offering a vast array of financing options directly to consumers. It is a dominant player in providing instant loans for electronics, home appliances, and furniture at thousands of retail stores, as well as offering personal loans and credit cards.
  • SME and commercial lending: Provides a range of financial solutions to small and medium-sized enterprises (SMEs) and commercial clients, including working capital loans and financing for business expansion. It also has a significant presence in lending to real estate developers. 

8. Infosys Ltd. (INFY)

  • Market cap: $67.31 billion
  • Revenue: $18.34 billion
  • Gross profit: $5.69 billion
  • 1-yr return: -23.31%
  • Exchange: NSE
  • Year founded: 1981
  • Country: India

A global leader in IT services and consulting, and one of the most prominent technology companies to emerge from India. It is a major competitor to other IT giants like TCS, Wipro, and Accenture.

  • Digital services and consulting: Focuses on helping large businesses modernise their technology through "digital transformation." This includes moving clients to the cloud, implementing AI and data analytics solutions, and enhancing cybersecurity.
  • Core enterprise services: Manages the foundational IT operations for its global clients. This involves application development and maintenance, modernising legacy systems, and outsourcing business processes to improve efficiency.

9. Hindustan Unilever Ltd. (HINDUNILVR)

  • Market cap: $66.07 billion
  • Revenue: $7.07 billion
  • Gross profit: $3.16 billion
  • 1-yr return: -15.17%
  • Exchange: NSE
  • Year founded: 1956
  • Country: India

India's largest Fast-Moving Consumer Goods (FMCG) company and a subsidiary of the British multinational, Unilever. Its products are a household staple, reaching nine out of ten Indian homes.

  • Home and personal care: This is HUL's largest division, encompassing a vast portfolio of iconic brands. It includes soaps and skincare (Lifebuoy, Lux, Dove), laundry detergents (Surf Excel, Rin), and surface cleaners (Vim).
  • Foods and refreshment: HUL is a major player in India's food and beverage market. Key brands include Brooke Bond and Lipton teas, Bru coffee, Knorr soups and noodles, and Kwality Wall's ice cream.

10. Life Insurance Corp. of India (LICI)

  • Market cap: $63.7 billion
  • Revenue: $101.18 billion
  • Gross profit: N/A
  • 1-yr return: -11.9%
  • Exchange: NSE
  • Year founded: 1956
  • Country: India

India's largest state-owned life insurer and a dominant force in the country's insurance sector. As a household name, it is one of the biggest institutional investors in the Indian stock market.

  • Insurance and pension plans: This is LIC's core business, offering a vast range of life insurance policies, annuities, and pension plans to millions of individual customers. It operates through an extensive network of over a million agents, giving it enormous reach into both urban and rural India.
  • Investment operations: LIC manages a colossal investment portfolio, making it a cornerstone of the Indian economy. It invests the premiums collected from policyholders into government securities and equities, making it one of the largest single investors in many Indian companies.

What are the biggest companies by total annual revenue?

  • Reliance Industries Ltd.: $108.41 billion 
  • Life Insurance Corp. of India: $101.18 billion 
  • Indian Oil Corp Ltd.: $85.38 billion 
  • State Bank of India: $74.06 billion 
  • Oil & Natural Gas Corp. Ltd.: $69.03 billion

What are the biggest companies by workforce?

  • Tata Consultancy Services Ltd.: 607,980
  • Quess Corp. Ltd.: 441,150 
  • Larsen & Toubro Ltd.: 412,970
  • Infosys Ltd.: 323,580 
  • Petrobras: 236,230

Summary

Understanding a company's performance is crucial; it's how you truly know what you own. These metrics directly drive the value of your stocks and funds. When you understand these key drivers, you can navigate market changes with confidence, rather than just reacting to headlines.

Next we’ll be looking at the biggest companies in Europe by market cap.

All market data sourced from TradingView and company reports as of 30.09.2025.

Thank you! Your submission has been received!
Oops! Something went wrong while submitting the form.