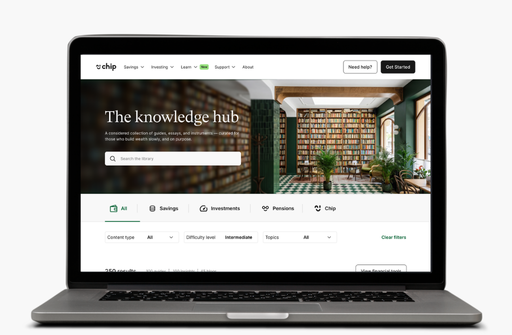
The knowledge hub

A considered collection of guides, essays, and instruments — curated for those who build wealth slowly, and on purpose.

0
results
View tools
Filter results
Filter by:
Content type
Difficulty level
Topics
0
results
View financial tools

Biggest companies in South America by market cap

2 min read
Expert
Global cap giants

What are the biggest companies in South America by market cap?

This list ranks South America’s biggest public companies by market capitalisation. We’ll also highlight other key figures, such as revenue, gross profit, and 1-year return. Key facts like the company's exchange, founding year, and country are also covered.

1. MercadoLibre (MELI)

  • Market cap: $127.3 billion
  • Revenue: $24.1 billion
  • Gross profit: $11.05 billion
  • 1-yr return: +18.99%
  • Exchange: NASDAQ
  • Year founded: 1999
  • Country: Uruguay

Often called the "Amazon of Latin America," MercadoLibre is the dominant e-commerce and payments platform in the region.

  • E-Commerce: Operates a massive online marketplace connecting millions of buyers and sellers.
  • Fintech: Its Mercado Pago division provides a full suite of financial services, including digital payments, credit, and asset management.

2. Petrobras (PBR)

  • Market cap: $82.4 billion
  • Revenue: $91.05 billion
  • Gross profit: $37.72 billion
  • 1-yr return: -10.15%
  • Exchange: NYSE
  • Year founded: 1953
  • Country: Brazil

Petrobras is Brazil's state-owned and largest oil and gas company, with a major focus on deep-water oil exploration and production.

  • Exploration and production: A global leader in deep and ultra-deepwater oil extraction technology.
  • Refining and distribution: Manages oil refineries, pipelines, and a large network of service stations across Brazil.

3. Nu Holdings (NU)

  • Market cap: $77.34 billion
  • Revenue: $10.33 billion
  • Gross profit: N/A
  • 1-yr return: +9.21%
  • Exchange: NYSE
  • Year founded: 2016
  • Country: Brazil

Nu Holdings is the parent company of Nubank, one of the world's largest independent digital banks. It has disrupted the traditional banking sector in Latin America.

  • Digital banking: Offers a user-friendly mobile app providing free credit cards, bank accounts, and loans.
  • International expansion: Rapidly growing its customer base in Mexico and Colombia in addition to its core Brazilian market.

4. Itaú Unibanco (ITUB)

  • Market cap: $73.74 billion
  • Revenue: $62.93 billion
  • Gross profit: N/A
  • 1-yr return: +20.56%
  • Exchange: NYSE
  • Year founded: 1924
  • Country: Brazil

Itaú Unibanco is Brazil's largest private-sector bank and one of the most valuable financial institutions in the world.

  • Retail banking: Provides a full range of services to millions of individual customers, including accounts, credit cards, and mortgages.
  • Wholesale banking: Caters to large companies and institutional investors with services like investment banking and treasury management.

5. Vale (VALE)

  • Market cap: $46.29 billion
  • Revenue: $38.21 billion
  • Gross profit: $12.55 billion
  • 1-yr return: -1.62%
  • Exchange: NYSE
  • Year founded: 1942
  • Country: Brazil

Vale is one of the world's largest producers of iron ore and nickel, key ingredients for the steel and electric vehicle industries.

  • Iron ore production: Operates vast mining complexes in Brazil, producing high-grade iron ore for the global steel market.
  • Base metals: A leading global producer of nickel, essential for EV batteries, as well as copper and cobalt.

6. Ambev (ABEV)

  • Market cap: $36.54 billion
  • Revenue: $16.59 billion
  • Gross profit: $7.67 billion
  • 1-yr return: -2.54%
  • Exchange: NYSE
  • Year founded: 1853
  • Country: Brazil

Ambev is a brewing giant and a subsidiary of Anheuser-Busch InBev. It is the largest beverage company in Latin America.

  • Beer production: Brews and distributes a huge portfolio of popular beer brands, including Skol, Brahma, and Antarctica.
  • Soft drinks: Holds the license to produce, sell, and distribute PepsiCo products in Brazil and other Latin American countries.

7. Banco Bradesco (BBD)

  • Market cap: $33.25 billion
  • Revenue: $55.8 billion
  • Gross profit: N/A
  • 1-yr return: +27.66%
  • Exchange: NYSE
  • Year founded: 1943
  • Country: Brazil

Banco Bradesco is one of Brazil's largest banking and financial services companies, known for its extensive branch network and insurance operations.

  • Banking: Offers a complete range of banking services to individuals, small businesses, and large corporations.
  • Insurance: A market leader in Brazil's insurance sector, providing auto, health, life, and property insurance.

8. WEG (WEGE3)

  • Market cap: $28.77 billion
  • Revenue: $7.1 billion
  • Gross profit: $12.86 billion
  • 1-yr return: -34.56%
  • Exchange: BMFBOVESPA
  • Year founded: 1961
  • Country: Brazil

WEG is a multinational company that is a global leader in the manufacturing of electric motors and industrial automation equipment.

  • Industrial motors: A top global supplier of electric motors, generators, and transformers for a wide range of industries.
  • Renewable energy: A major player in the wind and solar energy sectors, producing wind turbines and solar power components.

9. Ecopetrol (ECOPETROL)

  • Market cap: $19.78 billion
  • Revenue: $30.95 billion
  • Gross profit: $8.72 billion
  • 1-yr return: +4.86%
  • Exchange: NYSE
  • Year founded: 1948
  • Country: Colombia

Ecopetrol is Colombia's largest and primary petroleum company, engaged in all parts of the oil and gas chain.

  • Exploration and production: Manages oil and gas exploration and production activities primarily within Colombia.
  • Refining and petrochemicals: Operates the country's main refineries and is involved in the production of petrochemicals.

What are the biggest companies by total annual revenue?

  • Petrobras: $91.05 billion 
  • Itaú Unibanco: $62.93 billion 
  • Banco Bradesco: $55.80 billion 
  • Vale: $38.21 billion 
  • Ecopetrol: $30.95 billion

What are the biggest companies by workforce?

  • Vale: 236,100 
  • Ambev: 57,000 
  • MercadoLibre: 54,338 
  • Itaú Unibanco: 51,700 
  • Petrobras: 46,730

Summary

Understanding a company's performance is crucial; it's how you truly know what you own. These metrics directly drive the value of your stocks and funds. When you understand these key drivers, you can navigate market changes with confidence, rather than just reacting to headlines.

Next we’ll be looking at the biggest companies in India by market cap.

All market data sourced from TradingView and company reports as of 25.09.2025.

Biggest companies in China by market cap

2 min read
Expert
Global cap giants

What are the biggest companies in China by market cap?

This list ranks China’s biggest public companies by market capitalisation; the cumulative value of a company's total outstanding market shares. We’ll also be highlighting other key figures, such as the company's revenue, gross profit, and 1-year return (all based on the previous fiscal year). 

Some other key facts such as the exchange the company is listed on, the founding year and country the company is headquartered in are also covered.

1. Industrial and Commercial Bank of China (ICBC)

  • Market cap: $349 billion
  • Revenue: $221 billion
  • Gross profit: N/A 
  • 1-yr return: +34.6%
  • Exchange: SSE
  • Year founded: 1984
  • Country: China

ICBC is the world's largest bank by total assets. As one of China's "Big Four" state-owned commercial banks, it provides a comprehensive range of financial services to a massive customer base.

  • Corporate banking: Offers financial services to corporations, government agencies, and financial institutions, including loans, trade financing, and asset management.
  • Personal banking: Provides a full suite of services to individuals, including deposits, loans, credit cards, and wealth management.

2. Agricultural Bank of China (AgBank)

  • Market cap: $338 billion
  • Revenue: $193 billion
  • Gross profit: N/A
  • 1-yr return: +55.36%
  • Exchange: SSE
  • Year founded: 1951
  • Country: China

Another of the "Big Four" state-owned banks, AgBank was initially established to serve China's vast rural population but has since expanded into a major commercial bank.

  • Sannong banking: A core focus on providing financial services to the agriculture, rural areas, and farmer demographics.
  • Corporate & personal banking: Offers a wide range of standard banking services to both corporate and individual clients.

3. China Construction Bank Corp. (CCB)

  • Market cap: $267 billion
  • Revenue: N/A
  • Gross profit: N/A
  • 1-yr return: +27.48%
  • Exchange: SSE
  • Year founded: 1954
  • Country: China

CCB is one of the "Big Four" state-owned banks in China and is a market leader in infrastructure loans.

  • Infrastructure lending: A primary focus on providing long-term credit for major infrastructure projects like transportation and energy.
  • Corporate & personal banking: Offers comprehensive financial services, including corporate finance, personal banking, and treasury operations.

4. Kweichow Moutai Co.

  • Market cap: $265 billion
  • Revenue: $21.7 billion
  • Gross profit: $19.5 billion
  • 1-yr return: +12.17%
  • Exchange: SSE
  • Year founded: 1999
  • Country: China

Kweichow Moutai is the world's most valuable liquor company, famous for producing Moutai baijiu, a prestigious and fiery spirit that is considered China's national liquor.

  • Moutai Baijiu: Production of its high-end baijiu, a spirit distilled from fermented sorghum, which is a staple at state banquets and a popular luxury gift.

5. China Mobile Limited

  • Market cap: $245 billion
  • Revenue: $146 billion
  • Gross profit: $38.1 billion
  • 1-yr return: +8.04%
  • Exchange: SSE
  • Year founded: 1997
  • Country: China

China Mobile is the world's largest mobile network operator by number of subscribers, providing telecommunications and mobile services to a vast domestic market.

  • Mobile voice & data: Its core business involves providing mobile and 5G services to over 900 million subscribers.
  • Broadband & digital services: Offers wireline broadband and a range of digital services for both personal and corporate customers.

6. Contemporary Amperex Technology (CATL)

  • Market cap: $228 billion
  • Revenue: $52.3 billion
  • Gross profit: $12 billion
  • 1-yr return: +99.65%
  • Exchange: SZSE
  • Year founded: 2011
  • Country: China

CATL is the world's largest manufacturer of electric vehicle (EV) batteries, supplying a huge portion of the global automotive industry.

  • EV battery systems: Designs and manufactures rechargeable lithium-ion batteries for electric vehicles for major clients like Tesla, BMW, and Volkswagen.
  • Energy storage systems: Develops large-scale battery systems for storing energy from renewable sources like solar and wind.

7. PetroChina Co. Ltd.

  • Market cap: $217 billion
  • Revenue: N/A
  • Gross profit: N/A
  • 1-yr return: +7.36%
  • Exchange: SSE
  • Year founded: 1999
  • Country: China

PetroChina is China's largest oil and gas producer and distributor, playing a pivotal role in the country's energy sector.

  • Exploration & production: Manages the exploration, development, and production of crude oil and natural gas.
  • Refining & chemicals: Operates refineries and chemical plants to process crude oil into a wide range of petroleum and chemical products.

8. Bank of China Ltd.

  • Market cap: $175 billion
  • Revenue: $86.50 billion
  • Gross profit: N/A
  • 1-yr return: +16.13%
  • Exchange: SSE
  • Year founded: 1912
  • Country: China

The fourth of the "Big Four" state-owned banks, the Bank of China is the most international and diversified of the group.

  • International banking: Has a significant global presence, specializing in foreign exchange and international trade finance.
  • Corporate & personal banking: Provides a full range of financial services to clients both in mainland China and abroad.

9. Foxconn Industrial Internet Co.

  • Market cap: $166 billion
  • Revenue: $99 billion
  • Gross profit: $6.8 billion
  • 1-yr return: +224.07%
  • Exchange: SSE
  • Year founded: 2015
  • Country: China

A subsidiary of the Taiwanese giant Hon Hai Precision Industry (Foxconn), Fii focuses on the more advanced aspects of electronics manufacturing.

  • High-performance computing: Manufactures cloud servers, data centers, and industrial AI solutions.
  • 5G & IoT: A key producer of communications network equipment and Internet of Things (IoT) devices.

10. China Merchants Bank Co.

  • Market cap: $149 billion
  • Revenue: N/A
  • Gross profit: N/A
  • 1-yr return: +37.91%
  • Exchange: SSE
  • Year founded: 1987
  • Country: China

China Merchants Bank is China's largest non-state-owned bank and is widely regarded as a leader in the country's retail and private banking sectors.

  • Retail banking: A major focus on serving individual customers, particularly affluent clients, with a strong reputation for its credit card and wealth management services.
  • Corporate banking: Provides a range of services to corporate clients, though it is best known for its retail operations.

What are the biggest companies by total annual revenue?

  • PetroChina Co.: $431.66 billion 
  • Sinopec Corp.: $425.11 billion 
  • China State Construction Engineering: $305.88 billion 
  • China Mobile Limited: $145.74 billion 
  • Industrial and Commercial Bank of China: $120.33 billion

What are the biggest companies by workforce?

  • BYD Company: 968,870 
  • China Mobile Limited: 455,400 
  • Agricultural Bank of China: 454,720 
  • Industrial and Commercial Bank of China: 415,160 
  • China Construction Bank: 376,850

Summary

Understanding a company's performance is crucial; it's how you truly know what you own. These metrics directly drive the value of your stocks and funds. When you understand these key drivers, you can navigate market changes with confidence, rather than just reacting to headlines.

Next we’ll be looking at the biggest companies in South America by market cap.

All market data sourced from TradingView and company reports as of 17.09.2025.

Biggest companies in Europe by market cap

2 min read
Intermediate
Global cap giants

What are the biggest companies in Europe by market cap?

This list ranks Europe’s biggest public companies by market capitalisation: the cumulative value of a company's total outstanding market shares. We’ll also be highlighting other key figures, such as the company's revenue, gross profit, and 1-year return (all based on the previous fiscal year). 

Some other key facts such as the exchange the company is listed on, the founding year and country the company is headquartered in are also covered.

1. SAP SE

  • Market cap: $317.7 billion
  • Revenue: $37.56 billion
  • Gross profit: $26.98 billion
  • 1-yr return: +20.62%
  • Exchange: XETR
  • Year founded: 1972
  • Country: Germany

SAP is a global leader in enterprise application software. Its systems are a cornerstone of modern business operations.

  • Cloud & software: Provides cloud-based solutions and traditional software for managing business operations and customer relations, including ERP (Enterprise Resource Planning).
  • Services: Offers expert support, implementation services, and training to help customers maximize the value of their SAP applications.

2. LVMH Moët Hennessy Louis Vuitton

  • Market cap: $292.83 billion
  • Revenue: $94.62 billion
  • Gross profit: $65.34 billion
  • 1-yr return: -21.76%
  • Exchange: EURONEXT
  • Year founded: 1987
  • Country: France

LVMH is the world's largest luxury goods conglomerate, managing a diverse portfolio of prestigious brands.

  • Fashion & leather goods: The largest division, featuring iconic brands like Louis Vuitton, Christian Dior, and Fendi.
  • Wines & spirits: Owns world-renowned champagne and cognac houses such as Moët & Chandon, Hennessy, and Dom Pérignon.
  • Watches, jewellery, & retail: Includes brands like Tiffany & Co., Bulgari, and TAG Heuer, alongside selective retailers like Sephora.

3. ASML Holding N.V.

  • Market cap: $286.99 billion
  • Revenue: $30.13 billion
  • Gross profit: $15.48 billion
  • 1-yr return: -13.77%
  • Exchange: EURONEXT
  • Year founded: 1984
  • Country: Netherlands

ASML is a critical player in the semiconductor industry, holding a near-monopoly on the production of extreme ultraviolet (EUV) lithography machines.

  • Lithography systems: Designs and manufactures the complex machines that chipmakers like TSMC, Samsung, and Intel use to create the circuitry on microchips. These systems are essential for producing the most advanced processors in the world.

4. Roche Holding AG

  • Market cap: $259.40 billion
  • Revenue: $66.27 billion
  • Gross profit: $46.06 billion
  • 1-yr return: -3.58%
  • Exchange: SIX
  • Year founded: 1896
  • Country: Switzerland

Roche is a global pioneer in pharmaceuticals and diagnostics, focusing on advancing science to improve people's lives.

  • Pharmaceuticals: A world leader in oncology (cancer treatments) and also develops medicines for immunology, ophthalmology, and infectious diseases.
  • Diagnostics: Provides a wide range of innovative diagnostic tests and systems that help doctors detect, diagnose, and monitor diseases.

5. Novo Nordisk A/S

  • Market cap: $252.19 billion
  • Revenue: $36.70 billion
  • Gross profit: $30.87 billion
  • 1-yr return: -60.12%
  • Exchange: OMXCOP
  • Year founded: 1923
  • Country: Denmark

Novo Nordisk is a global healthcare company with a primary focus on treating chronic diseases, particularly diabetes.

  • Diabetes & obesity care: The world's leading supplier of insulin and has seen massive growth from its highly effective GLP-1 treatments for diabetes and weight loss, such as Ozempic and Wegovy.
  • Rare diseases: Develops and markets biopharmaceutical products for treating hemophilia and other rare blood and endocrine disorders.

6. Hermès International SCA 

  • Market cap: $251.24 billion
  • Revenue: $14.86 billion
  • Gross profit: $10.45 billion
  • 1-yr return: -21.56%
  • Exchange: EURONEXT
  • Year founded: 1837
  • Country: France

Hermès is an icon of high-end luxury, renowned for its exceptional craftsmanship, exclusivity, and timeless designs.

  • Leather goods & saddlery: The core of its business, famous for its highly sought-after Birkin and Kelly handbags.
  • Other categories: Produces a wide range of luxury goods, including silk scarves, ties, ready-to-wear fashion, perfumes, and watches.

7. AstraZeneca PLC

  • Market cap: $245.98 billion
  • Revenue: $47.92 billion
  • Gross profit: $39.42 billion
  • 1-yr return: -5.88%
  • Exchange: London Stock Exchange
  • Year founded: 1913
  • Country: United Kingdom

AstraZeneca is a global, science-led biopharmaceutical company with a focus on creating innovative prescription medicines.

  • Oncology: A world leader in cancer treatments, which forms a significant and growing part of its revenue.
  • Biopharmaceuticals: Develops medicines for major disease areas like cardiovascular, respiratory, and immunology.

8. L'Oréal S.A.

  • Market cap: $244.94 billion
  • Revenue: $45.93 billion
  • Gross profit: $33.72 billion
  • 1-yr return: +3.01%
  • Exchange: EURONEXT
  • Year founded: 1909
  • Country: France

L'Oréal is the world's largest cosmetics and beauty company, with a vast portfolio of brands covering all segments of the market.

  • Consumer products: Mass-market brands like Maybelline, Garnier, and L'Oréal Paris.
  • Luxe: High-end brands including Lancôme, Kiehl's, and Yves Saint Laurent Beauté.
  • Active cosmetics: Dermatological skincare brands such as La Roche-Posay and CeraVe.
  • Professional products: Supplies hair salons with brands like Kérastase and Redken.

9. Novartis AG

  • Market cap: $240.15 billion
  • Revenue: $50.31 billion
  • Gross profit: $37.89 billion
  • 1-yr return: +3.91%
  • Exchange: SIX
  • Year founded: 1996
  • Country: Switzerland

Novartis is a global healthcare company that provides solutions to address the evolving needs of patients worldwide.

  • Innovative medicines: Focuses on developing and marketing patented prescription drugs across various therapeutic areas, including cardiovascular, immunology, and neuroscience.
  • Sandoz (generic & biosimilars): Operates a major division that produces generic pharmaceuticals and biosimilars after patents on original drugs have expired.

10. Nestlé S.A.

  • Market cap: $237.10 billion
  • Revenue: $105.13 billion
  • Gross profit: $49.52 billion
  • 1-yr return: -16.87%
  • Exchange: SIX
  • Year founded: 1866
  • Country: Switzerland

Nestlé is the largest food and beverage company in the world, with a massive portfolio of well-known brands.

  • Powdered & liquid beverages: Includes major coffee brands like Nescafé, Nespresso, and Starbucks (packaged).
  • PetCare: A global leader with brands such as Purina, Friskies, and Fancy Feast.
  • Nutrition & health science: Produces infant formulas, health supplements, and medical nutrition.
  • Confectionery & packaged food: Owns iconic brands like KitKat, Maggi, and Toll House.

What are the biggest companies by total annual revenue?

  • Volkswagen Group: $305.98 billion 
  • Shell: $265.74 billion 
  • TotalEnergies: $208.61 billion 
  • Mercedes-Benz Group: $166.70 billion 
  • Uniper SE: $121.36 billion

What are the biggest companies by workforce?

  • Volkswagen Group: 684,013 
  • DHL Group: 594,439 
  • Schwarz Gruppe: 575,000 
  • Compass Group: 550,000 
  • Tesco: 337,255

Summary

Understanding a company's performance is crucial; it's how you truly know what you own. These metrics directly drive the value of your stocks and funds. When you understand these key drivers, you can navigate market changes with confidence, rather than just reacting to headlines.

Next we’ll be looking at the biggest companies in China by market cap.

All market data sourced from TradingView and company reports as of 04.09.2025.

Biggest companies in the UK by market cap

2 min read
Beginner
Global cap giants

What are the biggest companies in the UK by market cap?

This list ranks the UK’s biggest public companies by market capitalisation; the cumulative value of a company's total outstanding market shares. We’ll also be highlighting other key figures, such as the company's revenue, gross profit, and 1-year return (all based on the previous fiscal year). 

Some other key facts such as the exchange the company is listed on, the founding year and country the company is headquartered in are also covered.

1. AstraZeneca PLC

  • Market cap: £182.77 billion
  • Revenue: £43.67 billion
  • Gross profit: £31.67 billion
  • 1-yr return: - 10.57%
  • Exchange: London Stock Exchange
  • Year founded: 1913
  • Country: United Kingdom

AstraZeneca is a global, science-led biopharmaceutical company that focuses on the discovery, development, and commercialisation of prescription medicines.

  • Pharmaceuticals: A leading developer of treatments in major disease areas.
  • Global reach: Its innovative medicines are used by millions of patients worldwide.

2. HSBC Holdings PLC

  • Market cap: £164.23 billion
  • Revenue: £110.12 billion
  • Gross profit: N/A 
  • 1-yr return: + 42.14%
  • Exchange: London Stock Exchange
  • Year founded: 1959
  • Country: United Kingdom

HSBC is one of the world’s largest banking and financial services organisations, serving customers worldwide from offices in 62 countries and territories.

  • Wealth and personal banking: Provides a range of services from current accounts and mortgages to wealth management and insurance for individuals.
  • Commercial banking: Offers banking services to small, medium-sized, and large corporations.
  • Global banking and markets: Provides financial services and products to corporate, government, and institutional clients.

3. Shell PLC

  • Market cap: £158.58 billion
  • Revenue: £212.38 billion
  • Gross profit: £36.13 billion
  • 1-yr return: - 0.33%
  • Exchange: London Stock Exchange
  • Year founded: 2002
  • Country: United Kingdom

Shell is a global group of energy and petrochemical companies with a focus on the entire energy value chain.

  • Integrated gas and upstream: Explores for and extracts crude oil, natural gas, and natural gas liquids. It also markets and transports oil and gas.
  • Downstream and renewables: Turns crude oil into a range of refined products, which are moved and marketed around the world for domestic, industrial, and transport use. It is also investing heavily in low-carbon energy solutions like biofuels, hydrogen, and wind power.

4. Unilever PLC

  • Market cap: £114.06 billion
  • Revenue: £50.24 billion
  • Gross profit: N/A
  • 1-yr return: - 5.63%
  • Exchange: London Stock Exchange
  • Year founded: 1930
  • Country: United Kingdom

Unilever is one of the world's leading suppliers of Beauty & Wellbeing, Personal Care, Home Care, and Nutrition products with sales in over 190 countries.

  • Global brands: Owns over 400 brands, including Dove, Ben & Jerry's, Knorr, Lipton, Magnum, and Persil.
  • Consumer reach: Its products are used by 3.4 billion people every day.

5. British American Tobacco PLC

  • Market cap: £91.37 billion
  • Revenue: £25.6 billion
  • Gross profit: £16.58 billion
  • 1-yr return: + 46.86%
  • Exchange: London Stock Exchange
  • Year founded: 1902
  • Country: United Kingdom

British American Tobacco (BAT) is a leading, multi-category consumer goods business that provides tobacco and nicotine products to millions of consumers around the world.

  • Traditional tobacco: A leading global seller of cigarettes with brands like Dunhill, Kent, and Lucky Strike.
  • New categories: Investing heavily in a portfolio of non-combustible products, including vapour (Vuse), heated tobacco (glo), and modern oral nicotine pouches (Velo).

6. Rolls Royce Holdings 

  • Market cap: £90.23 billion
  • Revenue: £19.54 billion
  • Gross profit: £4.77 billion
  • 1-yr return: + 119.47%
  • Exchange: London Stock Exchange
  • Year founded: 1906
  • Country: United Kingdom

A world-leading industrial technology company that provides complex power and propulsion solutions for critical applications.

  • Civil aerospace: Designs and manufactures engines for large commercial aircraft like the Airbus A350 and Boeing 787.
  • Defence: A key supplier of engines for military aircraft and naval vessels worldwide.

7. Rio Tinto PLC

  • Market cap: £78.93 billion
  • Revenue: £41.53 billion
  • Gross profit: £10.08 billion
  • 1-yr return: - 4.47%
  • Exchange: London Stock Exchange
  • Year founded: 1873
  • Country: United Kingdom

Rio Tinto is a leading global mining group that focuses on finding, mining, and processing mineral resources.

  • Key materials: A major producer of iron ore for steel, aluminium for cars and smartphones, copper for wind turbines, and other essential minerals.
  • Global operations: Owns and operates open pit and underground mines, mills, refineries, and smelters, as well as a network of railways and ports.

8. BP PLC

  • Market cap: £66.81 billion
  • Revenue: £144.2 billion
  • Gross profit: £22.79 billion
  • 1-yr return: - 1.11%
  • Exchange: London Stock Exchange
  • Year founded: 1908
  • Country: United Kingdom

BP is a global integrated energy company that delivers solutions for heat, light, and mobility.

  • Oil and gas: Focuses on exploration, production, and refining of oil and natural gas.
  • Convenience & mobility: Operates a large network of retail service stations.
  • Low carbon energy: Investing in renewable energy sources, including bioenergy, hydrogen, and wind and solar power, as part of its transition to a net-zero company.

9. RELX PLC

  • Market cap: £62.96 billion
  • Revenue: £9.53 billion
  • Gross profit: £5.99 billion
  • 1-yr return: - 4.01%
  • Exchange: London Stock Exchange
  • Year founded: 1903
  • Country: United Kingdom

A global provider of information-based analytics and decision tools for professional and business customers.

  • Risk: Provides data and tools for evaluating risk for industries like insurance and banking.
  • Scientific, technical & medical: A major academic publisher through its Elsevier division.

10. GSK PLC

  • Market cap: £58.51 billion
  • Revenue: £31.63 billion
  • Gross profit: £22.68 billion
  • 1-yr return: + 13.88%
  • Exchange: London Stock Exchange
  • Year founded: 1715
  • Country: United Kingdom

GSK (formerly GlaxoSmithKline) is a global biopharma company with a focus on uniting science, technology, and talent to get ahead of disease together.

  • Vaccines: A world-leading vaccine business, providing protection against a range of infectious diseases.
  • Specialty medicines: Develops and manufactures innovative medicines for areas such as HIV, respiratory diseases, and immunology.

What are the biggest companies by total annual revenue?

  • Shell: £214.24 billion
  • Glencore: £180.76 billion
  • BP: £148.05 billion
  • HSBC: £116.6 billion
  • Tesco: £69.92 billion

What are the biggest companies by workforce?

  • Tesco: 336,430
  • HSBC: 211,000
  • Glencore: 150,000
  • Unilever: 120,040

Summary

Understanding a company's performance is crucial; it's how you truly know what you own. These metrics directly drive the value of your stocks and funds. When you understand these key drivers, you can navigate market changes with confidence, rather than just reacting to headlines.

Next we’ll be looking at the biggest companies in Europe by market cap.

All market data sourced from TradingView and company reports as of 01.09.2025.

Safeguarded benefits and your pension

2 min read
Beginner
Pension basics

What is a safeguarded benefit?

A safeguarded benefit is a promise about your pension. It might be a guaranteed income for life, or a guaranteed rate for turning your savings into an income.

Most modern pensions are simply a pot of money with no promise attached. These are called defined contribution pensions, and they’re the kind Chip is built for. Safeguarded benefits are more common in older pensions, often set up in the 1980s and 1990s.

The main types to look out for: 

  • Defined benefit (or final salary) pensions. These pay you a set income for life, based on your salary and how long you worked there. The income is guaranteed, so it doesn’t rise and fall with the stock market.
  • Guaranteed annuity rate (GAR). A promise that you can swap your pot for a guaranteed income at a set rate. Older rates are often far higher than the rates available today, so this can be very valuable.
  • Guaranteed (or protected) pension age. The right to take your pension earlier than the normal age, which is currently 55 and rising to 57 in April 2028. Transferring could mean losing this.
  • Guaranteed minimum pension (GMP). A minimum amount your scheme must pay you. You may have this if you were “contracted out” of part of the State Pension before April 1997.
  • Other guarantees. Some pensions also include guaranteed growth or bonus rates, or let you take more than the usual 25% as tax-free cash.

Why this matters

Guarantees like these are hard to find anywhere else, and you usually can’t replace them once they’re gone. Giving one up could leave you worse off in retirement. That’s why there are extra rules in place to protect you.

Can Chip accept a pension with safeguarded benefits?

No. Chip’s pension is built for old defined contribution pensions, which are a simple pot of money. We can’t accept a transfer that includes safeguarded benefits or guarantees, regardless of value. If your pension has a guarantee, the safest thing is usually to leave it where it is.

If you’re thinking about moving it

If you still want to move a pension that has guarantees you should consider whether to speak to a regulated financial adviser first. They can look at your situation and tell you whether it’s the right move for you.

In some cases the law requires this. If your safeguarded benefits are worth more than £30,000, you must take regulated advice before you can transfer, and the provider you’re leaving has to check that you’ve done so.

Before you transfer, check for:

  • a guaranteed income, or a guaranteed annuity rate
  • the right to take your pension before age 55
  • a guaranteed minimum pension, if you were contracted out
  • exit fees or penalties for leaving
  • valuable extras, such as life cover or extra tax-free cash

Your current provider can tell you. You can also check your most recent statement or your scheme booklet.

Not sure what you have?

If you’re not sure what type of pension you have, or whether it comes with any guarantees, ask your current provider. They can tell you for free.

Where to get free help

For free, impartial guidance, you can contact MoneyHelper, which is backed by the government.

To find a regulated financial adviser, you can use the directory on MoneyHelper, or check the Financial Conduct Authority register to know whether a firm or advisor is authorised by the FCA.

If you’re 50 or over, you can also book a free pension appointment with Pension Wise.

Biggest companies in the world by market cap

2 min read
Beginner
Global cap giants

What are the biggest companies in the world by market cap?

This list ranks the world’s biggest companies by market capitalisation, the cumulative value of a company's total outstanding market shares. We’ll also be highlighting other key figures, such as the company's revenue, gross profit, and 1-year return (all based on the previous fiscal year). 

Some other key facts such as the exchange the company is listed on, the founding year and country the company is headquartered in are also covered. 

1. NVIDIA Corp.

  • Market cap: $4.39 trillion
  • Revenue: $148.51 billion
  • Gross profit: $104.12 billion
  • 1-yr return: +42.87%
  • Exchange: Nasdaq
  • Year founded: 1993
  • Country: United States

NVIDIA designs powerful chip solutions supplying various innovative industries:

  • AI and datacentres: GPUs that companies like Microsoft and Google use to build AI services. 
  • Gaming: ‘GeForce’ graphics cards that power high-quality video games on PCs. 
  • Professional & Automotive: Chips for film special effects, car infotainment systems, and self-driving technology.

2. Microsoft Corp.

  • Market cap: $3.75 trillion
  • Revenue: $281.72 billion
  • Gross profit: $193.89 billion
  • 1-yr return: +20.93%
  • Exchange: Nasdaq
  • Year founded: 1975
  • Country: United States

Microsoft’s software offers a range of services to businesses and consumers:

  • Cloud computing: Supply computer power and storage to businesses using their Azure software. 
  • Software: The Windows operating system and Office suite (Word, Excel, Powerpoint) powers PCs and productivity for businesses and consumers.
  • Gaming: Own Xbox and major gaming franchises like Call of Duty.
  • Other: Invest in AI with their OpenAI partnership and own professional social network LinkedIn.

3. Apple Inc.

  • Market cap: $3.37 trillion
  • Revenue: $408.63 billion
  • Gross profit: $190.74 billion
  • 1-yr return: +0.67%
  • Exchange: Nasdaq
  • Year founded: 1976
  • Country: United States

Apple are a global giant in consumer electronics and digital services:

  • Consumer electronics: iPhone, Mac computers, iPads, the Apple Watch, and AirPods.
  • Services: App Store, Apple Music, iCloud storage, and Apple TV+.

4. Alphabet Inc. (Google)

  • Market cap: $2.53 trillion
  • Revenue: $371.21 billion
  • Gross profit: $218.73 billion
  • 1-yr return: +25.58%
  • Exchange: Nasdaq
  • Year founded: 2015
  • Country: United States

Most of Alphabets revenue comes from advertising on its Google Search and Youtube platforms:

  • Google Search & Ads: Core revenue stream comes from selling ads on their search engine and network of other websites. 
  • Android: Operating system with widespread applications in mobile devices.
  • Youtube: World’s largest online video platform, generating revenue from advertising on videos. 
  • Google Cloud: Cloud computing business that competes with Microsoft and Amazon.
  • Other bets: Series of investments in future facing projects (Access, Calico, CapitalG, GV, Verily, Waymo, and X)

5. Amazon.com Inc. 

  • Market cap: $2.43 trillion
  • Revenue: $670.04 billion
  • Gross profit: $332.38 billion
  • 1-yr return: +28.53%
  • Exchange: Nasdaq
  • Year founded: 1994
  • Country: United States

Amazon’s two main revenue streams are its world leading online store and cloud computing services:

  • E-Commerce: Amazon generates profit from selling its own products and charging commission to sellers on their platform. They also make money from advertising on the site and their Amazon Prime subscription services. 
  • Amazon Web Services (AWS): Largest revenue source for Amazon comes from its market leading cloud computing services — clients include Netflix and NASA.  

6. Meta Platforms Inc. 

  • Market cap: $1.89 trillion
  • Revenue: $178.8 billion
  • Gross profit: $146.53 billion
  • 1-yr return: +40.30%
  • Exchange: Nasdaq
  • Year founded: 2004
  • Country: United States

The social media giant that owns Facebook, Instagram, Messenger, and WhatsApp — nearly all of its revenue comes from the highly targeted advertising that reaches its user base.

  • Targeted ads: Driven by data collected from their users base that allows advertisers to target different user groups.
  • The Metaverse: Investing billions of dollars developing virtual and augmented reality hardware and software. 

7. Saudi Arabian Oil Co.

  • Market cap: $1.53 trillion
  • Revenue: $460.55 billion
  • Gross profit: $217.87 billion
  • 1-yr return: –14.29%
  • Exchange: Saudi Exchange
  • Year founded: 1933
  • Country: Saudi Arabia

State-owned energy giant that is one of the largest and most profitable oil producers in the world:

  • Exploration and extraction: Identifying, drilling and pumping sources of crude oil and natural gas, benefitting from having some of the lowest production costs in the world. 
  • Refinement and distribution: Refining crude oil into products like petrol, diesel, and chemicals, which are then sold globally.

8. Broadcom Inc. 

  • Market cap: $1.38 trillion
  • Revenue: $57.03 billion
  • Gross profit: $35.21 billion
  • 1-yr return: +78.29%
  • Exchange: Nasdaq
  • Year founded: 1961
  • Country: United States

Technology company designing chips for networking and smartphones, and sells essential software to large corporations. 

  • Semiconductors (Chips): They design and sell a wide range of chips essential for Wi-Fi and Bluetooth in smartphones (key supplier for Apple), as well as networking equipment in data centers. 
  • Cloud services: Large software companies (like VMware) that supply big businesses with IT and cloud computing infrastructure on a subscription basis. 

9. Tesla Inc.

  • Market cap: $1.12 trillion
  • Revenue: $92.72 billion
  • Gross profit: $16.21 billion
  • 1-yr return: –11.15%
  • Exchange: Nasdaq
  • Year founded: 2003
  • Country: United States

Tesla is the world’s leading manufacturer of electric vehicles, with further focus on energy and artificial intelligence.

  • Electric cars: Main source of revenue and profit comes from their line of EVs like the Model Y, Model 3, Model X and Cybertruck. 
  • Energy generation & storage: Renewable energy for consumers and businesses from solar panels and batteries — the Powerwall for homes and Megapack for utility companies. 
  • Future goals: A large portion of Tesla’s valuation is based on future plans for technology like full self-driving technology and developing humanoid robots. 

10. Berkshire Hathaway Inc.

  • Market cap: $1.05 trillion
  • Revenue: $370.15 billion
  • Gross profit: $89.41 billion
  • 1-yr return: +8.04%
  • Exchange: New York Stock Exchange
  • Year founded: 1893
  • Country: United States

A huge holdings company that owns and invests in a diverse network of businesses.

  • Owns companies: Key examples include GEICO (car insurance), BNSF (major American railway) and Duracell (batteries). The profits of all these companies flow into Berkshire. 
  • Invests in stocks: They own a huge stock portfolio with large holdings in Apple, American Express, Bank of America and the Coca-Cola Company.
  • The Model: They use cash from their businesses profits and stock growth to buy more businesses and stock, creating a powerful cycle of long-term growth. 

What are the biggest companies by total annual revenue?

  • Walmart: $680.00 billion
  • Amazon: $637.96 billion
  • Saudi Arabian Oil Co.: $479.17 billion
  • UnitedHealth Group: $400.28 billion
  • Apple: $391.04 billion

What are the biggest companies by workforce?

  • Walmart: 2.1 million
  • Amazon.com: 1.56 million
  • BYD: 968,870
  • Accenture: 774,000
  • Volkswagen: 679,470

Summary

Understanding a company's performance is crucial; it's how you truly know what you own. These metrics directly drive the value of your stocks and funds. When you understand these key drivers, you can navigate market changes with confidence, rather than just reacting to headlines.

Next we’ll be looking at the biggest companies in the United Kingdom by market cap

All market data sourced from TradingView as of 26.08.2025.

What is an investment time horizon?

2 min read
Beginner
Portfolio building

Understanding investment time horizons

Investment time horizons will vary depending on where you are in your investing journey, your strategy and typically, your age. These timelines are not necessarily fixed, and horizons may evolve over time with changing market conditions, retirement and tax rules, and your goals. 

Short-term investment horizon

Short-term investing is any holding period up to five years. These investments wouldn’t be appropriate for higher risk assets like stocks, as immediate market downturn could derail your progress towards a short-term goal without giving your portfolio the necessary time to recover. 

Lower-risk investments like short-term bonds, money market funds, or high interest savings accounts allow you to focus on capital preservation, and aim to outpace inflation, without the potential for big price swings.

These might be suitable for investors who need easy access to their cash, such as those approaching retirement. 

Medium-term investment horizon

Medium-term investing is any holding period up to ten years. These investments have some time to ride out the ups and downs of the market and potentially benefit from compounding returns. 

A balanced allocation between higher risk assets like stocks and funds, and lower risk assets like bonds and money market funds can offer some protection whilst aiming to outperform inflation and generate some growth. Investors could tailor their approach to a more aggressive or defensive strategy based on their risk tolerance and goals. 

Read our full guide on aggressive and defensive investing strategies

Long-term investment horizon

Long-term investing is any holding period of more than ten years. These investments have the most time to ride out the ups and downs of the markets, so investors may want to consider a higher portion of equities in their portfolio to take advantage of this. 

Goals associated with long-term investments are typically retirement or setting money aside for your family to inherit. You aren’t just putting money away, you’re planting a seed for the long-term, on the belief that the global economy will grow over a long period of time. 

Read our full guide on retirement and long-term investing. 

How to plan your investment goals

Aligning your investment horizon with your goals, risk tolerance and capacity for loss is essential; and not doing so could be costly.

For example, trying to build your entire retirement fund in five years isn’t likely to be successful, and going all in on higher-risk assets might leave you overexposed to risk, and potentially worse off than you’d be if you just focused on preserving capital.

It might feel tempting to speculate when markets are moving in a positive direction, but the ‘fear of missing out’ on a good stock market rally often kicks in before a market bubble is about to burst.

So, make a plan for each investment and stick to it as making too many decisions can be a costly mistake for investors trying to reach a specific goal. 

See our full guide on behavioural investing and common mistakes.

Investment time horizon summary

Short-term goals (under 5 years) prioritise capital preservation, favouring lower-risk assets like bonds and savings accounts. Medium-term horizons (up to 10 years) allow for a balanced approach, mixing stocks and bonds to achieve growth while managing risk.

For long-term goals (10+ years), such as retirement, investors might take on more risk with a higher allocation to equities, allowing maximum time for growth and to recover from any market downturns.

Aligning your goals, risk tolerance and capacity for loss with the correct time horizon can potentially prevent costly mistakes, like taking on too much risk for a short-term need or being too conservative for long-term growth.

Rebalancing your portfolio

2 min read
Expert
Portfolio building

What is portfolio rebalancing?

Rebalancing a portfolio means adjusting your investments back to their original mix of assets in line with your goal, risk tolerance, capacity for loss and time horizon when market changes cause them to drift.

Over time, some investments grow faster than others, which can leave you with more risk (or less) than you intended. Rebalancing helps keep your portfolio aligned with your goals, risk tolerance and capacity for loss.

How to rebalance your portfolio

Start by asking yourself a few key questions:

  • Am I still comfortable with my original asset allocation?
  • Has my financial situation or goals changed since I set it?
  • Is my portfolio more aggressive or more conservative than I’d like it to be?
  • Has my risk tolerance or capacity for loss changed?

If the answers suggest your portfolio has drifted away from where you want it to be, it’s time to consider rebalancing.

Simple steps to rebalance your portfolio

There are a few different approaches investors use:

  • Selling and buying. Selling some of the investments that have grown beyond your target and using the proceeds to buy more of the underweighted assets.
  • Adding new funds. Directing new contributions into areas of your portfolio that are underrepresented, rather than selling anything.
  • Automatic rebalancing. Some platforms and funds offer built-in rebalancing, adjusting your portfolio for you on a set schedule.

Which method you choose depends on your investment style, account type, and comfort level with making changes.

See our full guide on portfolio management.

How often should I rebalance my portfolio?

There’s no strict rule, but generally checking your portfolio consistently, once or twice a year or if your circumstances have changed.

Some investors prefer a “threshold” method, where they only rebalance if allocations drift by more than 5-10% from their targets.

The key is consistency, regular reviews and not overreacting to every short-term market movement.

Advantages of portfolio rebalancing

  • It keeps your portfolio aligned with your goals and risk profile.
  • Improves diversification over time.
  • Reduces the chance of being overexposed to one asset or sector.
  • Helps manage volatility and risk.
  • Supports long-term investing discipline.

Disadvantages of portfolio rebalancing

  • May reduce exposure to sectors that are currently performing well.
  • Could increase exposure to underperforming assets.
  • May trigger taxes or transaction fees, depending on your account type.
  • Requires time, effort, and a clear understanding of your goals.

Rebalancing your portfolio summary

Rebalancing is a practical way to keep your portfolio on track as markets shift. By comparing your current allocation to your target, making adjustments where necessary, and sticking to a consistent review schedule, you can manage risk and stay aligned with your long-term goals.

Next in this series: Pound-cost averaging and how investing small amounts regularly can reduce risk and smooth out returns.

What is pound cost averaging?

2 min read
Beginner
Portfolio building

Understanding pound cost averaging

Pound cost averaging means investing the same amount on a regular basis. As a result of making steady investments, your invested ‘pounds’ are exposed to many different market prices, rather than one (potentially) high price. 

This price averaging helps to smooth out the ups and downs of the market, and potential exposure to a case of bad market timing.

An example of pound cost averaging

Imagine you decide to invest £200 a month on the first day of each month into your portfolio. Here’s how it might look invested over a fluctuating market environment:

  • January - Share price: £10. Shares purchased: 20
  • February - Share price: £8. Shares purchased: 25
  • March - Share price: £12.50. Shares purchased: 16
  • April - Share price: £10. Shares purchased: 20

You invested a total of £800 over four months, acquired 81 shares, at an average market price of £10.13.

However, because you invested consistently over this period and took advantage of the price dip in February, your personal average cost per share was £9.88.

You avoided the risk of investing a single lump sum of £800 in March when prices were at their highest. 

Benefits of pound cost averaging

  • Reduces market timing risk: spreads your investments out over time, reducing potential exposure to a high market price if you invested a lump sum. 
  • Disciplines investor behaviour: automating regular investments removes emotion from the investment process and encourages long-term thinking. 
  • Lowers the average cost per share: your fixed investment naturally buys more shares when prices are low and fewer when they are high.
  • Makes investing accessible: ideal for those who don’t have a large lump sum to invest upfront, and want to invest small amounts regularly.
  • Take advantage of volatility: market dips and downturns become beneficial because they allow your regular investment to purchase assets at a discount. 

What is lump sum investing?

The opposite of spreading your investments out using pound cost averaging is lump sum investing — the ‘all in one go’ approach. 

Instead of smoothing out the ups and down of the market by investing little and often, a lump sum investment can act differently. By entering into the market at one price, you may be buying in at either a high or low price. 

Investing at a high price, the market could dip, causing immediate loss in portfolio value. Historically markets have trended upwards, so staying the course and not reacting to short-term fluctuations is crucial. That said, this may be one reason that lump sum investing is less suitable for new investors. 

At a low price, investors may benefit from immediate portfolio growth. However, timing the market has historically proved difficult, and this is why many investors opt for pound cost averaging instead of trying to get in at a low price with a lump sum.

So, which is actually better? There are arguments for and against both pound cost averaging and lump sum investing.

Looking purely through the lens of returns, research suggests that taking advantage of time in the market leads to greater returns and potentially lowers your costs over the long term — if you are able to use a lump sum to invest and stay the course.1

See our full guide on behavioural investing and common mistakes.

1Morningstar

Adapting pound cost averaging to your financial goals

Pound cost averaging isn’t a ‘one size fits all’ strategy, and investors can adapt contributions and investments to suit their needs:

  • Aggressive strategy might focus on more frequent investments into higher risk assets and sector specific funds, accepting greater risk of short-term losses but willing to stay the course.
  • Defensive strategy might focus on steady investments into dividend paying assets, bonds or cash equivalents. 

See our full guide on aggressive and defensive investing strategies.

Pound cost averaging summary

Pound cost averaging can help smooth out market volatility and remove the stress of trying to ‘time the market’. It can help lower your average cost per share over time by automatically buying more shares when prices are low and fewer when they are high. 

Practicing ‘pound cost averaging’ is not a guarantee of returns, but if you want to follow a popular principle of investing that uses time as a tool, it’s a great place to start. 

Lump sum investing can help you take advantage of time in the market, but buying at one price might leave you exposed to short-term price swings, so staying the course is important. 

Next in this series: Investment time horizon, how time is your best friend when it comes to setting investment goals. 

Thank you! Your submission has been received!
Oops! Something went wrong while submitting the form.